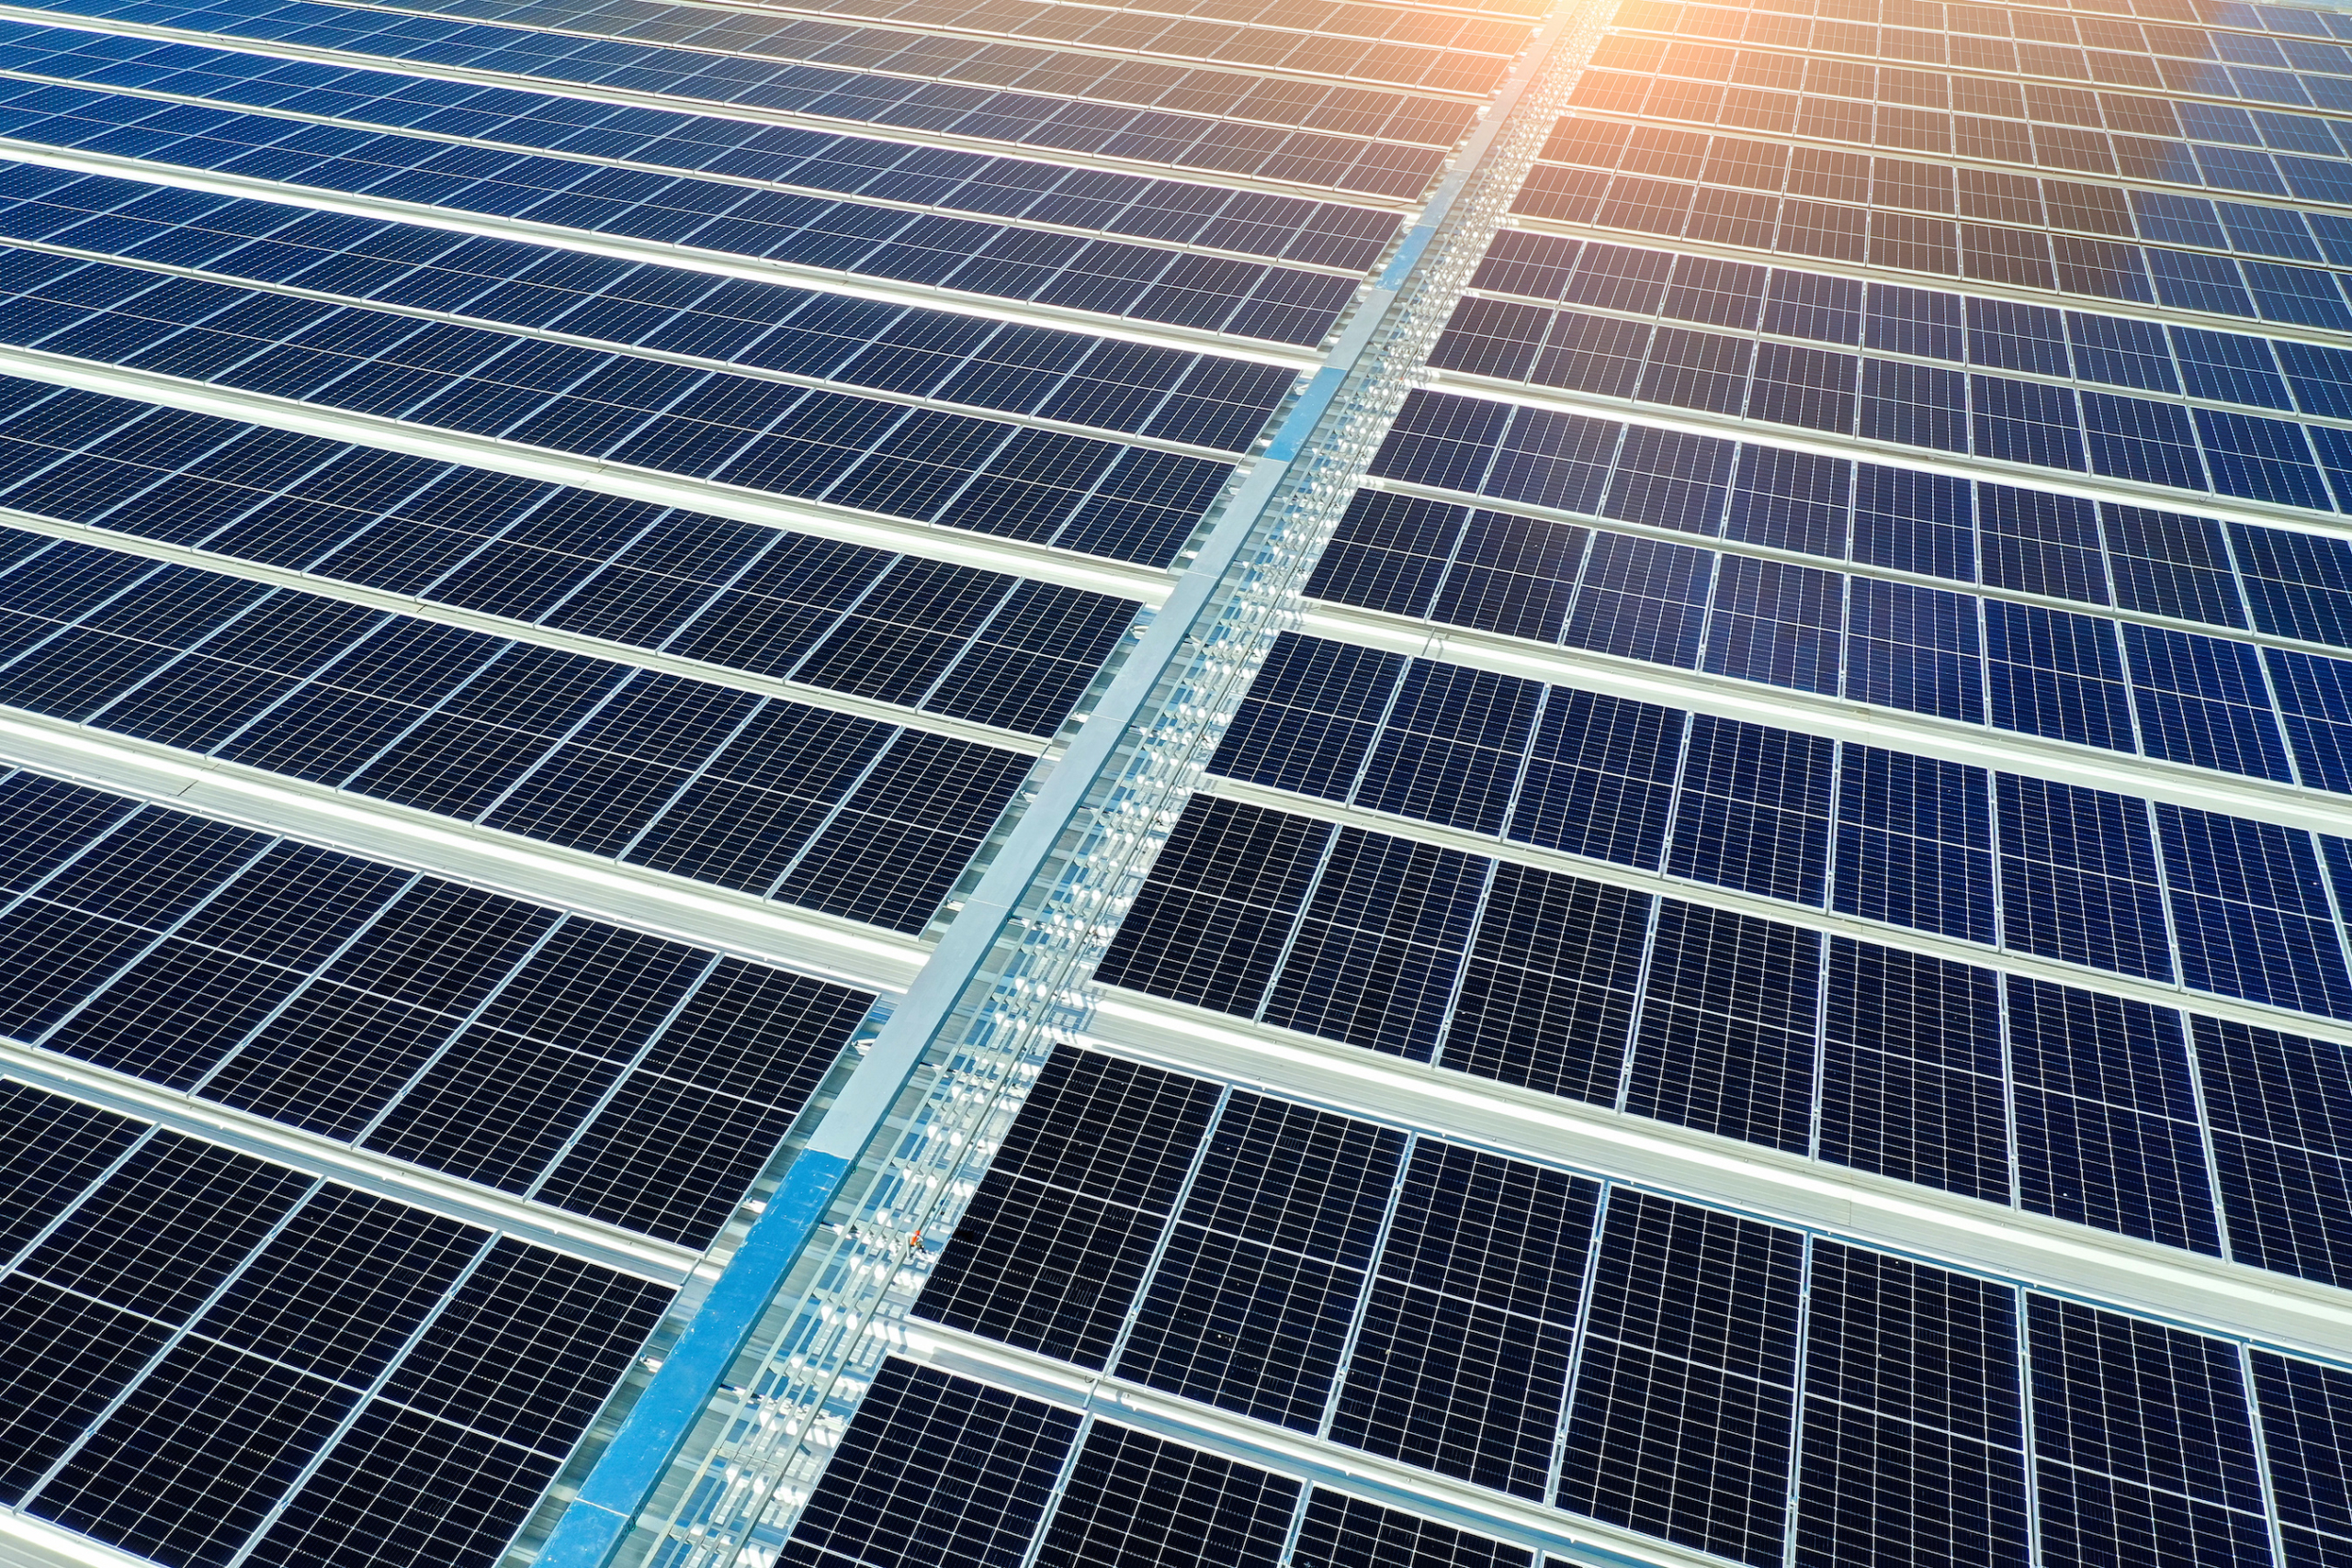
500 MWac / 650 MWp utility-scale solar PV project in Zambia’s Copperbelt Province. The project is being developed on a secured 603-hectare site adjacent to an existing 330 kV transmission line and represents one of the largest solar developments in the country.
The project benefits from a signed 25-year US Dollar-denominated Take-or-Pay PPA with the country’s government-owned utility, providing long-term contracted revenue visibility and inflation protection through US PPI indexation. The PPA is supported by a direct sovereign payment guarantee from the Government of Zambia.
The sponsor is seeking selected EPC&F partners and Tier-1 institutional equity investors to complete the capital structure alongside a multilateral debt syndicate involving IFC, African Development Bank and U.S. DFC, with a MIGA-covered commercial tranche.
KEY INVESTMENT HIGHLIGHTS
|
|
| Plant Capacity |
500 MWac / 650 MWp DC |
| Project Location |
Copperbelt Province, Zambia |
| Site Area |
603.1 hectares |
| PPA Term |
25 years |
| Contracted Tariff |
US$0.080/kWh |
| Revenue Escalation |
US PPI — 2% floor / 4% cap p.a. |
| Offtake Structure |
Take-or-Pay |
| Off-taker |
Government-owned national utility |
| Total Project Cost |
US$519M |
| Capital Structure |
75% Senior Debt / 25% Equity |
| 25-Year Cumulative Revenue |
US$3.05B |
| Sponsor Base Equity IRR |
23.9% post-tax |
| Bank Case Equity IRR |
17.5% |
| Money Multiple |
11.5x |
| Target COD |
Q3 2029 |
Source: project materials.
CONTRACTED REVENUE MODEL
The investment case is underpinned by long-term contracted USD revenues, materially reducing exposure to merchant power-price volatility during the PPA period.
PPA STRUCTURE
- Contracted tariff: US$0.080/kWh
- Term: 25 years from COD
- Offtake: Take-or-Pay
- Indexation: US PPI-linked
- Escalation collar: 2% floor / 4% cap per annum
- Off-taker: Government-owned national utility
- PPA signed: 28 May 2026
- Contracted revenue: approximately US$3.05B cumulative over 25 years
The PPA provides a long-duration USD revenue profile with contractual inflation protection through US PPI indexation.
SOVEREIGN-BACKED SECURITY PACKAGE
The project benefits from a multi-layered contractual and political-risk protection structure.
TIER 1 — SOVEREIGN SUPPORT
The Government of Zambia provides an irrevocable Payment of Last Resort, together with a four-tier termination payment waterfall designed to protect debt and equity, including a 12% equity IRR floor. The package also includes tax and FX stabilisation provisions.
TIER 2 — OFF-TAKER SECURITY
The PPA provides a 25-year USD Take-or-Pay commitment, supported by a standby Letter of Credit and make-whole provisions for deemed generated energy.
TIER 3 — LENDER PROTECTION
Lenders benefit from step-in, cure and novation rights, payment redirection mechanisms and designated insurance proceeds protection.
TIER 4 — POLITICAL RISK INSURANCE
The structure includes MIGA Non-Honouring of Sovereign Obligations coverage, addressing inconvertibility, expropriation, war and breach of contract, together with an ATIDI regional political-risk overlay.
PROJECT & DEVELOPMENT STATUS
The project has progressed beyond the early development stage and has secured key contractual and regulatory milestones.
- PPA signed: 28 May 2026
- Energy Regulation Board Conditional Approval: received 18 June 2026
- Implementation Agreement: in advanced negotiation
- Target Financial Close: 12–15 months from PPA signing
- Target Commercial Operations: Q3 2029
- Phase 1 revenue: targeted from Q3 2028
- Transmission: adjacent to existing 330 kV line
FINANCIAL PROFILE
BASE CASE
| Financial Metric |
Projected |
| Total Project Cost |
US$519M |
| Senior Debt |
75% |
| Equity |
25% |
| Sponsor Base Equity IRR |
23.9% post-tax |
| Bank Case Equity IRR |
17.5% |
| 25-Year Money Multiple |
11.5x |
| Cumulative Revenue |
US$3.05B |
The project’s base case indicates a 23.9% post-tax sponsor equity IRR, with a 17.5% bank-case equity IRR under stress-tested assumptions.
TECHNOLOGY & ASSET PROFILE
The project will deploy fixed-tilt bifacial N-type TOPCon solar PV technology, selected for its mature technology profile, absence of moving parts and suitability for utility-scale deployment in the region.
The 500 MWac facility is planned in three phases of 300 MWac, 100 MWac and 100 MWac, creating a phased construction and commissioning structure.
ADDITIONAL VALUE CREATION
CONTRACTED CARBON REVENUE
The project is estimated to generate approximately 1.1 million tCO₂e of carbon credits annually, with potential contracted carbon offtake revenue of up to US$13.8M per year.
Importantly, this potential upside is excluded from the base-case equity returns, creating an additional value-creation opportunity for investors.
REGIONAL PIPELINE
The sponsor is developing a broader regional pipeline across Malawi, Mozambique and the Democratic Republic of Congo, using a similar project and financing framework.
| Line Item |
Y1 (2029) |
Y2 (2030) |
Y5 (2033) |
Y10 (2038) |
Y15 (2043) |
Y18 (2046) |
Y25 (2053) |
| Net Generation (GWh) |
1,267.5 |
1,261.2 |
1,242.4 |
1,211.7 |
1,181.7 |
1,164.1 |
1,123.9 |
| Effective Tariff ($/kWh) |
$0.0800 |
$0.0820 |
$0.0883 |
$0.1000 |
$0.1131 |
$0.1218 |
$0.1448 |
| PPA Revenue ($M) |
101.40 |
103.42 |
109.73 |
121.13 |
133.67 |
141.80 |
162.77 |
| Operating Expenses ($M) |
(7.00) |
(7.18) |
(7.73) |
(8.74) |
(9.89) |
(10.65) |
(12.66) |
| EBITDA ($M) |
94.40 |
96.24 |
102.00 |
112.39 |
123.78 |
131.15 |
150.11 |
| EBITDA Margin |
93.1% |
93.1% |
93.0% |
92.8% |
92.6% |
92.5% |
92.2% |
| Depreciation ($M) |
(34.60) |
(34.60) |
(34.60) |
(34.60) |
(34.60) |
0.00 |
0.00 |
| Senior Interest ($M) |
(27.25) |
(26.39) |
(23.51) |
(17.38) |
(9.24) |
(2.59) |
0.00 |
| EBT ($M) |
32.55 |
35.25 |
43.89 |
60.41 |
79.94 |
128.56 |
150.11 |
| Corporate Tax (20%) ($M) |
(6.51) |
(7.05) |
(8.78) |
(12.08) |
(15.99) |
(25.71) |
(30.02) |
| Project CFADS ($M) |
87.89 |
89.19 |
93.22 |
100.31 |
107.79 |
105.44 |
120.09 |
| Senior Principal Repayment |
(12.34) |
(13.20) |
(16.08) |
(22.21) |
(30.35) |
(36.99) |
0.00 |
| Total Senior Debt Service |
(39.59) |
(39.59) |
(39.59) |
(39.59) |
(39.59) |
(39.59) |
0.00 |
| Free Cash Flow to Equity (FCFE) |
48.30 |
49.60 |
53.63 |
60.72 |
68.20 |
65.85 |
120.09 |
| Senior DSCR |
2.22x |
2.25x |
2.35x |
2.53x |
2.72x |
2.66x |
N/A |
IMPORTANT LEGAL DISCLAIMER & NOTICE
1. Informational & Illustrative Purposes Only This financial model, project summary, and accompanying projections (the “Materials”) are prepared solely for preliminary informational and discussion purposes. They do not constitute, and shall not be construed as, an offer to sell, a solicitation of an offer to buy, or a recommendation to purchase any security, debt instrument, equity interest, or financial product, nor do they constitute a commitment by any party to provide financing, equity underwriting, or debt syndication.
2. Forward-Looking Statements & Projections The cash flow projections, internal rates of return (IRRs), debt service coverage ratios (DSCRs), money multiples, generation figures, and tariff indexations contained herein are forward-looking statements. These forward-looking statements are based upon a series of operational, regulatory, macroeconomic, and technical assumptions—including, without limitation, solar irradiation (P50/P90), degradation rates, US PPI escalation collars, grid availability, off-taker payment performance, and foreign exchange convertibility. Forward-looking statements are inherently subject to significant business, economic, sovereign, and competitive uncertainties and contingencies, many of which are beyond the control of the project developers and sponsors. Actual results may differ materially from those expressed or implied in these projections.
3. No Reliance & Independent Due Diligence No representation or warranty, express or implied, is made by the sponsor, financial modeler, or any of their respective affiliates, directors, officers, or advisors as to the accuracy, completeness, or reasonableness of the information or projections contained in these Materials. Prospective institutional equity investors, EPC&F partners, and prospective lenders must conduct their own independent technical, environmental, tax, accounting, and legal due diligence, including an independent assessment of:
-
The sovereign payment guarantee, termination waterfall, and legal enforceability under Zambian law;
-
The creditworthiness and operational stability of the national off-taker;
-
Interconnection, grid stability, and curtailment risks associated with the 330 kV transmission infrastructure; and
-
The terms, pricing, and availability of political risk insurance (including MIGA and ATIDI covers) and multilateral debt financing (IFC, AfDB, DFC).
4. No Financial, Legal, or Tax Advice These Materials do not constitute legal, tax, accounting, regulatory, or investment advice. Each recipient should consult its own independent legal counsel, tax advisors, and financial consultants to determine the commercial, legal, and financial merits and risks of participating in the proposed transaction.











Description
500 MWac / 650 MWp utility-scale solar PV project in Zambia’s Copperbelt Province. The project is being developed on a secured 603-hectare site adjacent to an existing 330 kV transmission line and represents one of the largest solar developments in the country.
The project benefits from a signed 25-year US Dollar-denominated Take-or-Pay PPA with the country’s government-owned utility, providing long-term contracted revenue visibility and inflation protection through US PPI indexation. The PPA is supported by a direct sovereign payment guarantee from the Government of Zambia.
The sponsor is seeking selected EPC&F partners and Tier-1 institutional equity investors to complete the capital structure alongside a multilateral debt syndicate involving IFC, African Development Bank and U.S. DFC, with a MIGA-covered commercial tranche.
KEY INVESTMENT HIGHLIGHTS
Source: project materials.
CONTRACTED REVENUE MODEL
The investment case is underpinned by long-term contracted USD revenues, materially reducing exposure to merchant power-price volatility during the PPA period.
PPA STRUCTURE
The PPA provides a long-duration USD revenue profile with contractual inflation protection through US PPI indexation.
SOVEREIGN-BACKED SECURITY PACKAGE
The project benefits from a multi-layered contractual and political-risk protection structure.
TIER 1 — SOVEREIGN SUPPORT
The Government of Zambia provides an irrevocable Payment of Last Resort, together with a four-tier termination payment waterfall designed to protect debt and equity, including a 12% equity IRR floor. The package also includes tax and FX stabilisation provisions.
TIER 2 — OFF-TAKER SECURITY
The PPA provides a 25-year USD Take-or-Pay commitment, supported by a standby Letter of Credit and make-whole provisions for deemed generated energy.
TIER 3 — LENDER PROTECTION
Lenders benefit from step-in, cure and novation rights, payment redirection mechanisms and designated insurance proceeds protection.
TIER 4 — POLITICAL RISK INSURANCE
The structure includes MIGA Non-Honouring of Sovereign Obligations coverage, addressing inconvertibility, expropriation, war and breach of contract, together with an ATIDI regional political-risk overlay.
PROJECT & DEVELOPMENT STATUS
The project has progressed beyond the early development stage and has secured key contractual and regulatory milestones.
FINANCIAL PROFILE
BASE CASE
The project’s base case indicates a 23.9% post-tax sponsor equity IRR, with a 17.5% bank-case equity IRR under stress-tested assumptions.
TECHNOLOGY & ASSET PROFILE
The project will deploy fixed-tilt bifacial N-type TOPCon solar PV technology, selected for its mature technology profile, absence of moving parts and suitability for utility-scale deployment in the region.
The 500 MWac facility is planned in three phases of 300 MWac, 100 MWac and 100 MWac, creating a phased construction and commissioning structure.
ADDITIONAL VALUE CREATION
CONTRACTED CARBON REVENUE
The project is estimated to generate approximately 1.1 million tCO₂e of carbon credits annually, with potential contracted carbon offtake revenue of up to US$13.8M per year.
Importantly, this potential upside is excluded from the base-case equity returns, creating an additional value-creation opportunity for investors.
REGIONAL PIPELINE
The sponsor is developing a broader regional pipeline across Malawi, Mozambique and the Democratic Republic of Congo, using a similar project and financing framework.
IMPORTANT LEGAL DISCLAIMER & NOTICE
1. Informational & Illustrative Purposes Only This financial model, project summary, and accompanying projections (the “Materials”) are prepared solely for preliminary informational and discussion purposes. They do not constitute, and shall not be construed as, an offer to sell, a solicitation of an offer to buy, or a recommendation to purchase any security, debt instrument, equity interest, or financial product, nor do they constitute a commitment by any party to provide financing, equity underwriting, or debt syndication.
2. Forward-Looking Statements & Projections The cash flow projections, internal rates of return (IRRs), debt service coverage ratios (DSCRs), money multiples, generation figures, and tariff indexations contained herein are forward-looking statements. These forward-looking statements are based upon a series of operational, regulatory, macroeconomic, and technical assumptions—including, without limitation, solar irradiation (P50/P90), degradation rates, US PPI escalation collars, grid availability, off-taker payment performance, and foreign exchange convertibility. Forward-looking statements are inherently subject to significant business, economic, sovereign, and competitive uncertainties and contingencies, many of which are beyond the control of the project developers and sponsors. Actual results may differ materially from those expressed or implied in these projections.
3. No Reliance & Independent Due Diligence No representation or warranty, express or implied, is made by the sponsor, financial modeler, or any of their respective affiliates, directors, officers, or advisors as to the accuracy, completeness, or reasonableness of the information or projections contained in these Materials. Prospective institutional equity investors, EPC&F partners, and prospective lenders must conduct their own independent technical, environmental, tax, accounting, and legal due diligence, including an independent assessment of:
The sovereign payment guarantee, termination waterfall, and legal enforceability under Zambian law;
The creditworthiness and operational stability of the national off-taker;
Interconnection, grid stability, and curtailment risks associated with the 330 kV transmission infrastructure; and
The terms, pricing, and availability of political risk insurance (including MIGA and ATIDI covers) and multilateral debt financing (IFC, AfDB, DFC).
4. No Financial, Legal, or Tax Advice These Materials do not constitute legal, tax, accounting, regulatory, or investment advice. Each recipient should consult its own independent legal counsel, tax advisors, and financial consultants to determine the commercial, legal, and financial merits and risks of participating in the proposed transaction.
Basic Details
Target Price:
$ 0
Gross Revenue
$101,400,000
EBITDA
$9,400,000
Business ID:
L#20261157
Country
Zambia
Detail
Published on September 15, 2026 at 8:58 am. Updated on September 15, 2026 at 8:58 am