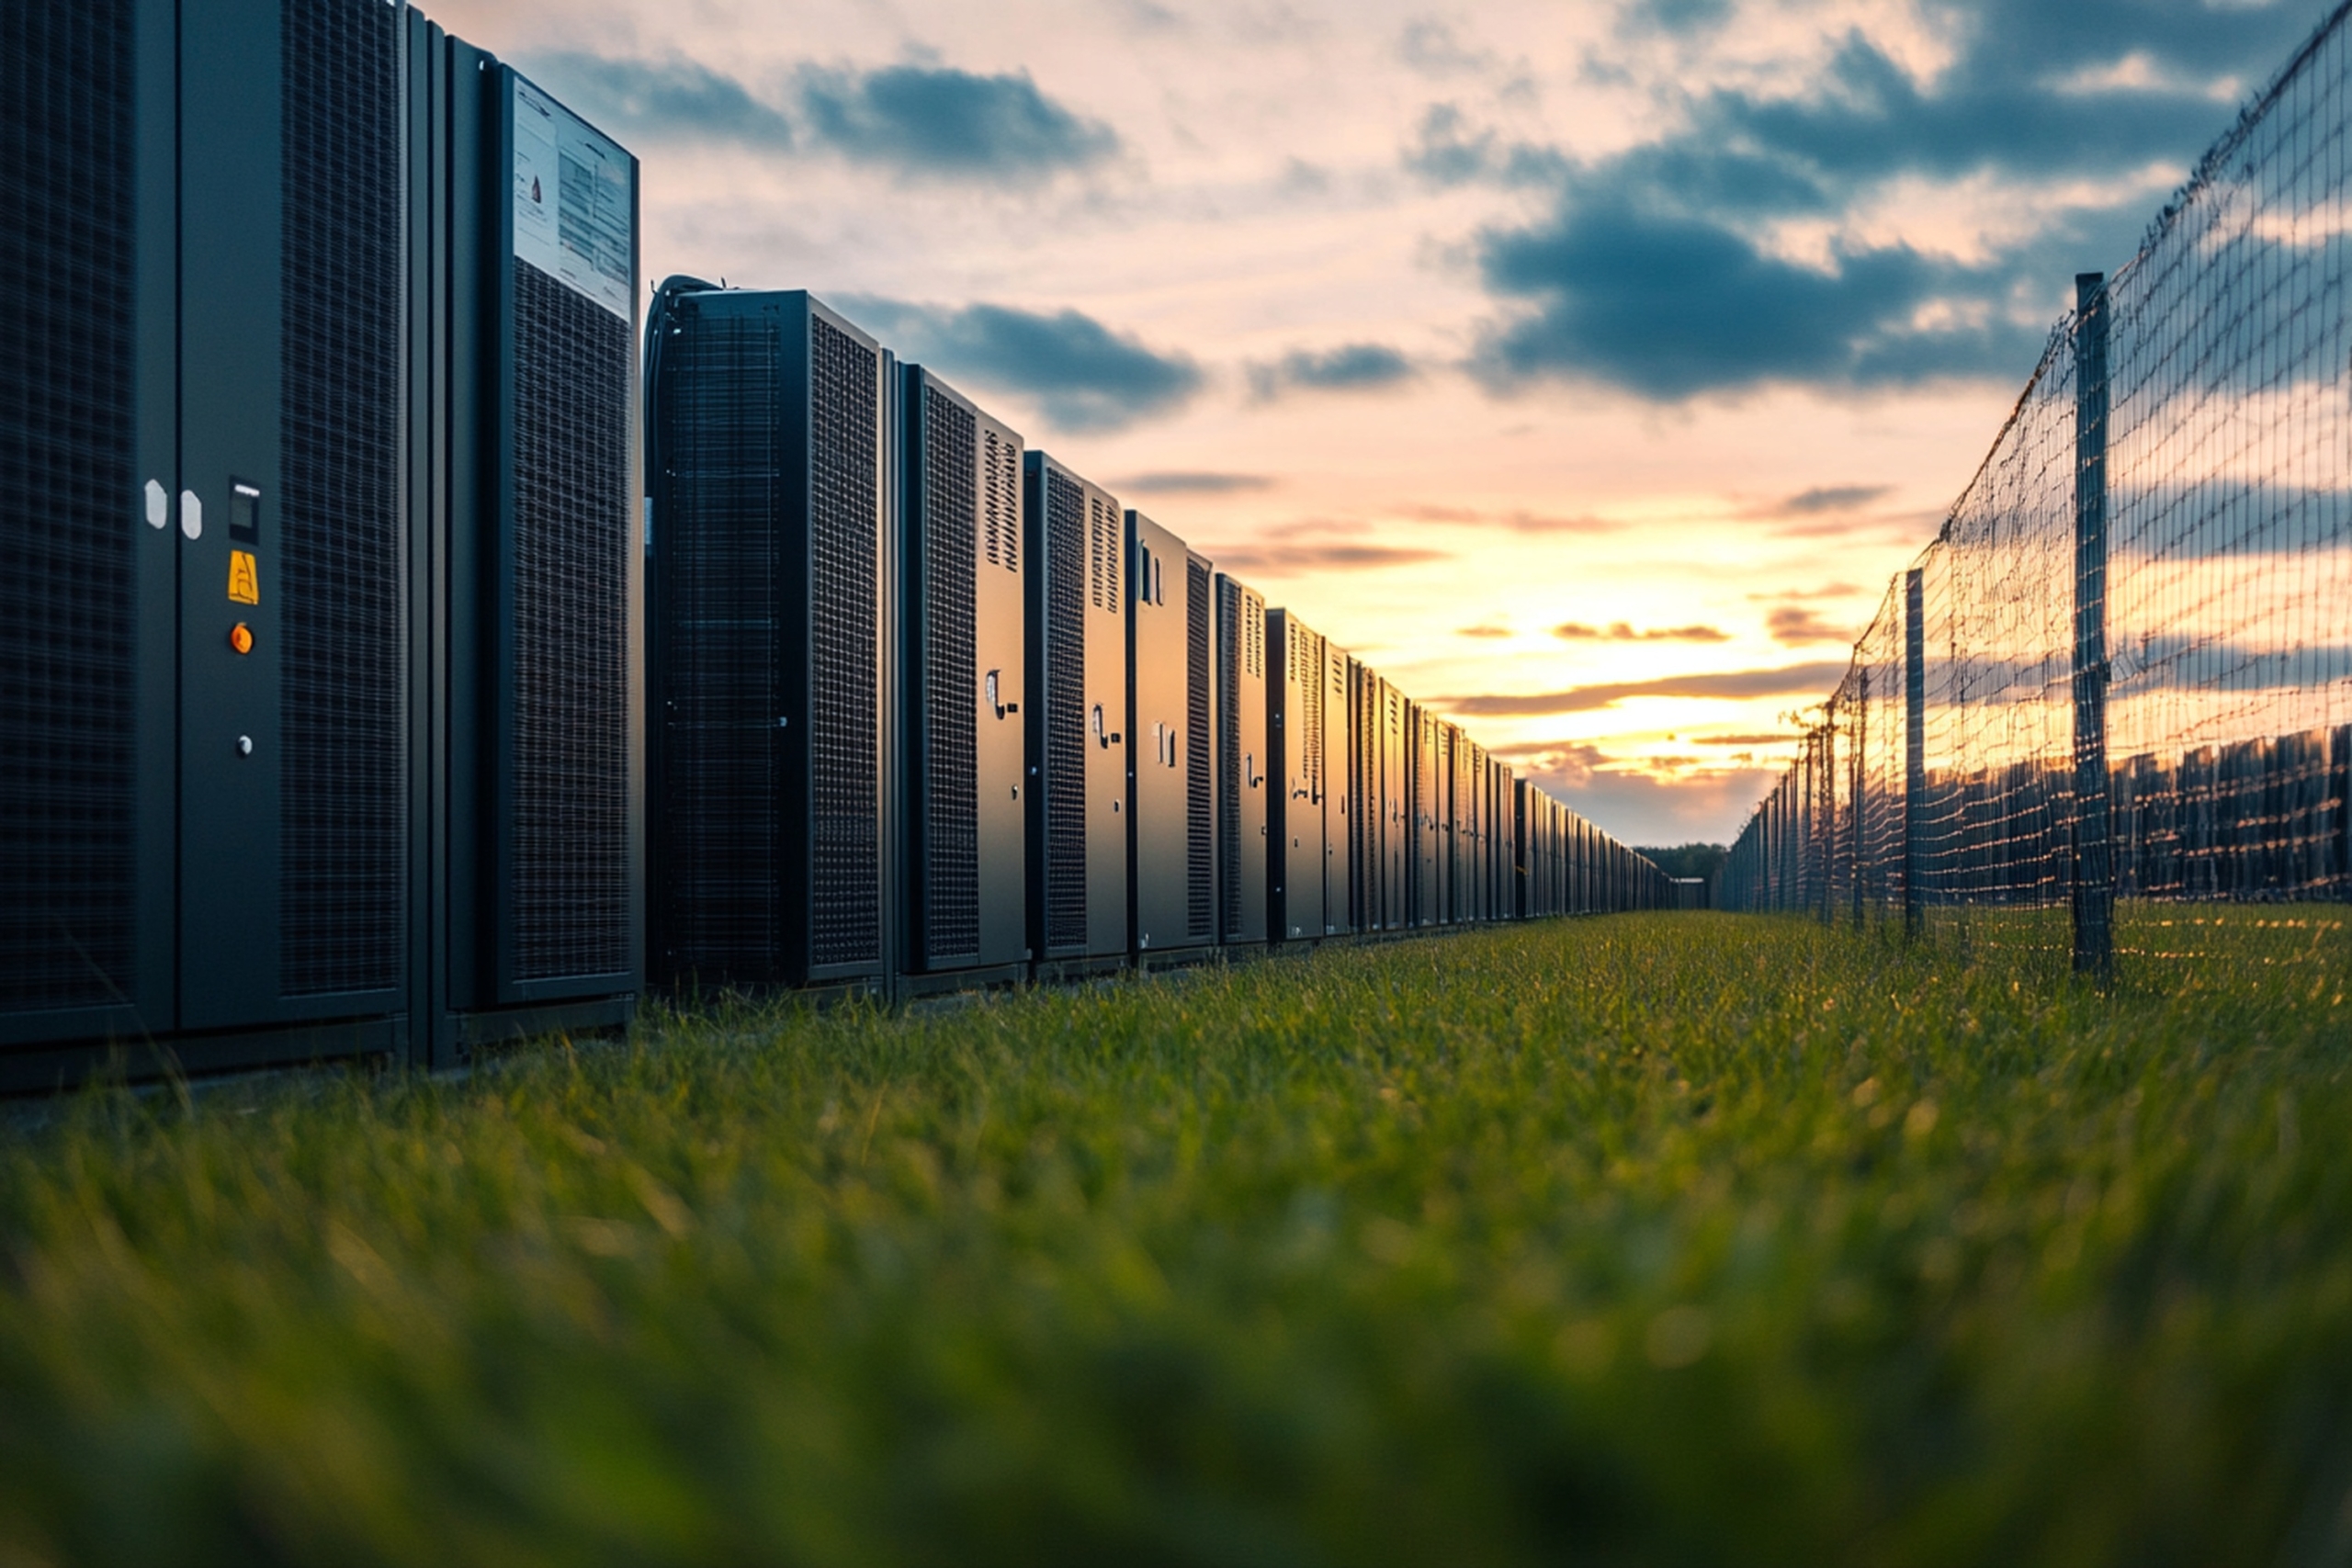
The 1GW BESS Project in Italy is a pioneering, utility-scale 1,000 MW (1 GW) stand-alone Battery Energy Storage System located in the strategic industrial and energy corridor of Italy. Developed by the project sponsor, this landmark asset is positioned to become one of the largest standalone battery storage systems in the world.
Strategic Value & Grid Synergies
Italy is one of Europe’s densest and most critical clean energy generation basins. However, the rapid expansion of solar and wind power has placed immense stress on the local high-voltage transmission network. The BESS project is uniquely co-located with some of the region’s largest generation assets:
-
3 GW Offshore Wind Pipeline: Strategically positioned to absorb and smooth future power from over 3 GW of planned offshore wind capacity.
-
90 MW Solar PV Plant: Ready to capture and time-shift energy from an already approved 90 MW photovoltaic installation.
By operating under “load leveling” and “peak shaving” configurations, the project stores excess, cheap renewable generation during peak production hours and discharges it back into the high-voltage network during times of high demand. This localized buffering significantly reduces transmission line congestion and prevents the costly curtailment of green energy.
Technical Readiness & Low-Risk Profile
Unlike early-stage greenfield developments, this project has successfully cleared its most complex regulatory and technical hurdles:
-
Secured Grid Connection (STMG): The vital grid connection solution (Soluzione Tecnica Minima Generale) has already been officially granted and released by Italy’s transmission system operator, Terna.
-
Privileged Regulatory Pathway: The project is located entirely on approximately 25 hectares of flat, constraint-free land. Because it is officially classified as a “suitable area” (area idonea) under Italian Art. 20 of Legislative Decree 199/2021, it benefits from streamlined, fast-track permitting.
-
Secured Land Rights: The complete layout is secured via a long-term land lease option granted in favor of the dedicated Special Purpose Vehicle (SPV).
Key Project Milestones
The project is on a structured, de-risked pathway toward commercial operations:
-
AU (Single Authorization) Submission: June 21, 2024 (Completed)
-
CdS (Services Conference) Launch: December 20, 2024 (Completed)
-
Expected Final Permit (AU) Decree: 30 August 2026 (Completed)
-
Start of On-Site Construction: Q4 2026 (OPEN)
-
Commercial Operation Date (COD): Q4 2027 (OPEN)
The Investment Thesis
-
Unprecedented Scale: A 1,000 MW capacity offers significant economies of scale, optimal procurement leverage, and a dominant market presence in Southern Italy’s grid-balancing market.
-
Regulatory Tailwinds: Italy’s updated PNIEC climate targets have risen to 131.3 GW of renewables by 2030, which can only be achieved with massive, fast-responding BESS capacity.
-
Structured Capacity Revenues: The asset is eligible to bid into Terna’s capacity market auctions, unlocking long-term, highly predictable, and legally secured capacity payment structures.
1. Capital Structure & Financing Sources
| Funding Source |
Share (%) |
Amount (€M) |
All-in Rate |
Tenor |
Repayment Profile |
| Senior Debt |
85.00% |
321.88 |
4.50% |
15 years |
Equal annual principal (€21.46M/yr) |
| Junior Debt |
7.50% |
28.40 |
4.50% |
15 years |
Equal annual principal (€1.89M/yr) |
| Total Debt |
92.50% |
350.29 |
4.50% |
15 years |
Equal annual principal (€23.35M/yr) |
| Equity |
7.50% |
28.40 |
— |
— |
Paid-in Equity at Financial Close |
| Total CapEx |
100.00% |
378.69 |
— |
— |
Central Scenario |
2. Consolidated Debt Amortization Schedule (Y1 – Y15)
Figures in €M
| Period |
Opening Balance |
Interest (Senior) |
Interest (Junior) |
Total Interest |
Total Principal |
Total Debt Service |
Closing Balance |
| Y1 |
350.29 |
14.48 |
1.28 |
15.76 |
23.35 |
39.12 |
326.93 |
| Y2 |
326.93 |
13.52 |
1.19 |
14.71 |
23.35 |
38.06 |
303.58 |
| Y3 |
303.58 |
12.55 |
1.11 |
13.66 |
23.35 |
37.01 |
280.23 |
| Y4 |
280.23 |
11.59 |
1.02 |
12.61 |
23.35 |
35.96 |
256.88 |
| Y5 |
256.88 |
10.62 |
0.94 |
11.56 |
23.35 |
34.91 |
233.52 |
| Y6 |
233.52 |
9.66 |
0.85 |
10.51 |
23.35 |
33.86 |
210.17 |
| Y7 |
210.17 |
8.69 |
0.77 |
9.46 |
23.35 |
32.81 |
186.82 |
| Y8 |
186.82 |
7.72 |
0.68 |
8.41 |
23.35 |
31.76 |
163.47 |
| Y9 |
163.47 |
6.76 |
0.60 |
7.36 |
23.35 |
30.71 |
140.11 |
| Y10 |
140.11 |
5.79 |
0.51 |
6.31 |
23.35 |
29.66 |
116.76 |
| Y11 |
116.76 |
4.83 |
0.43 |
5.25 |
23.35 |
28.61 |
93.41 |
| Y12 |
93.41 |
3.86 |
0.34 |
4.20 |
23.35 |
27.56 |
70.06 |
| Y13 |
70.06 |
2.90 |
0.26 |
3.15 |
23.35 |
26.50 |
46.70 |
| Y14 |
46.70 |
1.93 |
0.17 |
2.10 |
23.35 |
25.45 |
23.35 |
| Y15 |
23.35 |
0.97 |
0.09 |
1.05 |
23.35 |
24.40 |
0.00 |
3. Debt Service Coverage Ratio (DSCR) Profile
Bankability threshold: Min DSCR > 1.20x
| Metric / Year |
Y1 |
Y2 |
Y3 |
Y4 |
Y5 |
Y6 |
Y7 |
Y8 |
Y9 |
Y10 |
10-Yr Min |
10-Yr Avg |
| Debt Service (€M) |
39.12 |
38.06 |
37.01 |
35.96 |
34.91 |
33.86 |
32.81 |
31.76 |
30.71 |
29.66 |
— |
— |
| Realistic Scenario |
4.02x |
4.12x |
4.13x |
4.15x |
4.16x |
4.19x |
4.21x |
4.24x |
4.27x |
4.30x |
4.02x |
4.18x |
| Optimistic Scenario |
5.17x |
5.30x |
5.32x |
5.35x |
5.38x |
5.41x |
5.45x |
5.50x |
5.55x |
5.60x |
5.17x |
5.40x |
| Stress Scenario (−25%) |
2.87x |
2.94x |
2.94x |
2.94x |
2.95x |
2.96x |
2.97x |
2.99x |
3.01x |
3.03x |
2.87x |
2.95x |
4. Levered Free Cash Flow to Equity (FCFE)
Formula: FCFE = Net Profit after Tax + Depreciation − Total Debt Service (€M)
| Scenario / Year |
Y0 |
Y1 |
Y2 |
Y3 |
Y4 |
Y5 |
Y6 |
Y7 |
Y8 |
Y9 |
Y10 |
| Realistic |
−47.96 |
41.59 |
42.39 |
40.65 |
38.96 |
37.31 |
35.71 |
34.16 |
32.64 |
31.17 |
29.74 |
| Cumulative Realistic |
−47.96 |
−6.37 |
36.02 |
76.67 |
115.63 |
152.94 |
188.65 |
222.81 |
255.45 |
286.62 |
316.36 |
| Optimistic |
−47.96 |
74.04 |
74.83 |
72.45 |
70.12 |
67.85 |
65.64 |
63.48 |
61.38 |
59.34 |
57.35 |
| Cumulative Optimistic |
−47.96 |
26.08 |
100.91 |
173.35 |
243.47 |
311.32 |
376.96 |
440.44 |
501.82 |
561.16 |
618.51 |
| Stress (−25%) |
−47.96 |
9.15 |
9.94 |
8.85 |
7.80 |
6.78 |
5.79 |
4.83 |
3.90 |
3.01 |
2.14 |
| Cumulative Stress |
−47.96 |
−38.81 |
−28.87 |
−20.02 |
−12.22 |
−5.45 |
0.34 |
5.18 |
9.07 |
12.08 |
14.23 |
5. Return & Valuation Metrics (85% Senior + 7.5% Junior @ 4.50%)
| Parameter / Metric |
Realistic Scenario |
Optimistic Scenario |
Stress Scenario (−25%) |
Unit / Definition |
| Total Equity Required (incl. DSRA) |
47.96 |
47.96 |
47.96 |
€M at Financial Close |
| Equity IRR (10-Year After-Tax) |
85.28% |
153.76% |
6.48% |
Levered after IRES (24%) + IRAP (3.9%) |
| Equity IRR (20-Year After-Tax) |
85.40% |
153.77% |
13.07% |
20-year operational horizon |
| Non-Discounted Payback Period |
1.15 |
0.65 |
5.94 |
Years from COD |
| 10-Year Equity Multiple (MOIC) |
7.59x |
13.89x |
1.29x |
Total 10-yr Equity CF / Y0 Equity Outflow |
| 10-Year Minimum DSCR |
4.02x |
5.17x |
2.87x |
Minimum annual DSCR (Year 1) |
| 10-Year Average DSCR |
4.18x |
5.40x |
2.95x |
Average DSCR (Years 1 to 10) |











Description
The 1GW BESS Project in Italy is a pioneering, utility-scale 1,000 MW (1 GW) stand-alone Battery Energy Storage System located in the strategic industrial and energy corridor of Italy. Developed by the project sponsor, this landmark asset is positioned to become one of the largest standalone battery storage systems in the world.
Strategic Value & Grid Synergies
Italy is one of Europe’s densest and most critical clean energy generation basins. However, the rapid expansion of solar and wind power has placed immense stress on the local high-voltage transmission network. The BESS project is uniquely co-located with some of the region’s largest generation assets:
3 GW Offshore Wind Pipeline: Strategically positioned to absorb and smooth future power from over 3 GW of planned offshore wind capacity.
90 MW Solar PV Plant: Ready to capture and time-shift energy from an already approved 90 MW photovoltaic installation.
By operating under “load leveling” and “peak shaving” configurations, the project stores excess, cheap renewable generation during peak production hours and discharges it back into the high-voltage network during times of high demand. This localized buffering significantly reduces transmission line congestion and prevents the costly curtailment of green energy.
Technical Readiness & Low-Risk Profile
Unlike early-stage greenfield developments, this project has successfully cleared its most complex regulatory and technical hurdles:
Secured Grid Connection (STMG): The vital grid connection solution (Soluzione Tecnica Minima Generale) has already been officially granted and released by Italy’s transmission system operator, Terna.
Privileged Regulatory Pathway: The project is located entirely on approximately 25 hectares of flat, constraint-free land. Because it is officially classified as a “suitable area” (area idonea) under Italian Art. 20 of Legislative Decree 199/2021, it benefits from streamlined, fast-track permitting.
Secured Land Rights: The complete layout is secured via a long-term land lease option granted in favor of the dedicated Special Purpose Vehicle (SPV).
Key Project Milestones
The project is on a structured, de-risked pathway toward commercial operations:
AU (Single Authorization) Submission: June 21, 2024 (Completed)
CdS (Services Conference) Launch: December 20, 2024 (Completed)
Expected Final Permit (AU) Decree: 30 August 2026 (Completed)
Start of On-Site Construction: Q4 2026 (OPEN)
Commercial Operation Date (COD): Q4 2027 (OPEN)
The Investment Thesis
Unprecedented Scale: A 1,000 MW capacity offers significant economies of scale, optimal procurement leverage, and a dominant market presence in Southern Italy’s grid-balancing market.
Regulatory Tailwinds: Italy’s updated PNIEC climate targets have risen to 131.3 GW of renewables by 2030, which can only be achieved with massive, fast-responding BESS capacity.
Structured Capacity Revenues: The asset is eligible to bid into Terna’s capacity market auctions, unlocking long-term, highly predictable, and legally secured capacity payment structures.
1. Capital Structure & Financing Sources
2. Consolidated Debt Amortization Schedule (Y1 – Y15)
3. Debt Service Coverage Ratio (DSCR) Profile
4. Levered Free Cash Flow to Equity (FCFE)
5. Return & Valuation Metrics (85% Senior + 7.5% Junior @ 4.50%)
Basic Details
Target Price:
EUR 150,000,000
Gross Revenue
€175,000,000
EBITDA
€157,000,000
Business ID:
L#20261107
Country
Italy
Detail
Published on July 14, 2026 at 7:56 pm. Updated on September 13, 2026 at 9:59 pm