
- Home
- Mining Businesses
- American Pre-Drill Natural Gas & Helium Asset
American Pre-Drill Natural Gas & Helium Asset
© 2026 MergersCorp M&A International.
© 2025 MergersCorp M&A International is a global brand operating through a number of professional firms and constituent entities (“Members”) located throughout the world to provide Investment Banking, Corporate Finance, and Advisory Services and other client-related professional services. The Member Firms (“Members”) are constituted and regulated in accordance with relevant local regulatory and legal requirements. For more details on the nature of our affiliation, please visit our Disclaimer: https://mergerscorp.com/disclaimer. MergersCorp M&A International's franchising program is not offered to individuals or entities located in the United States.
The franchising program is offered by MergersUK Limited, a UK Company with its registered office at 71-75 Shelton Street, Covent Garden, London, WC2H 9JQ, United Kingdom.
MergersCorp M&A International provides strategic business advisory services, including preparing companies for growth and capital access. Through partnerships with licensed investment bankers, clients can access tailored capital-raising solutions.
U.S. Investment Banking Securities transactions are exclusively conducted by Spektrum Capital Advisors LLC, a Registered Representative of, and Securities Products offered through, BA Securities, LLC, a FINRA-registered broker-dealer. Check the background of investment professionals associated with this site on Broker Check.
American Pre-Drill Natural Gas & Helium Asset

Core Investment Thesis & Strategic Moat
-
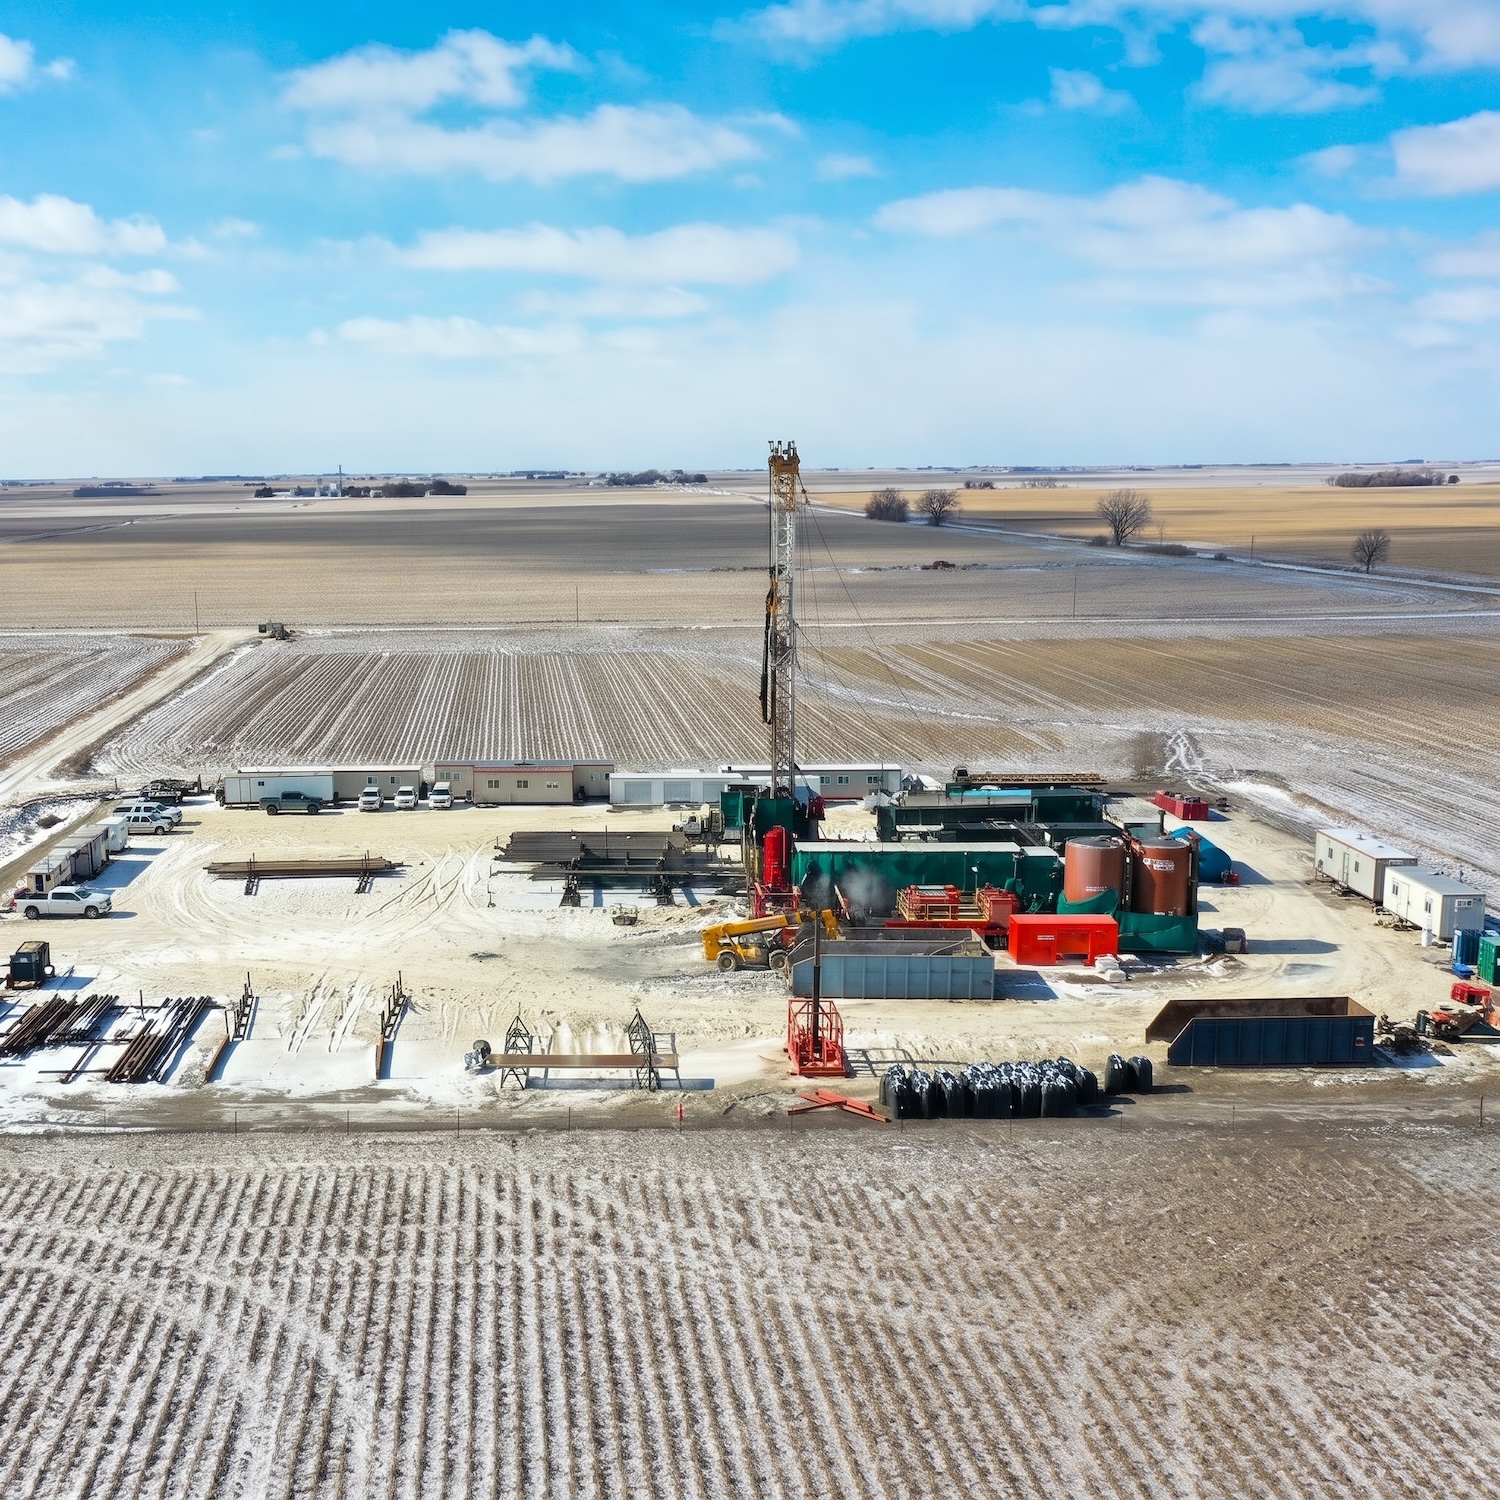
Empirical Field Provenance: The venture’s proprietary predictive geological targeting is backed by direct historical operating leadership on the first benchmark U.S. natural hydrogen exploration well (drilled in Fillmore County, Nebraska in 2019), which logged high-grade wellhead gas tests of 44% hydrogen and 12.8% helium.
-
Disruptive Cost & Carbon Profile: Natural geologic extraction yields an estimated production cost of $0.50 to $1.00 per kg of hydrogen with an ultra-low carbon intensity (~0.4 kg CO2e per kg of hydrogen), heavily outcompeting both green water-electrolysis ($4.50 to $12.00 per kg) and fossil grey SMR ($1.00 to $3.00 per kg) routes.
-
High-Margin Helium Kicker: Helium demand in advanced semiconductor manufacturing, quantum computing, cryogenics, and aerospace creates an outsized revenue cushion. Modeled conservatively at an initial 2% concentration by volume and priced at a discount to spot, helium serves as a primary driver of project capital efficiency and early payback.
-
Texas Jurisdiction & Infrastructure Advantage: Texas provides clear administrative and mineral rights pathways (~1 month / ~$200K acquisition profile), competitive rig mobilization rates, and direct access to heavy industrial offtake clusters (refineries, ammonia, methanol, and chemical complexes) along Gulf Coast distribution corridors.
Capital Tranches & Milestone De-Risking Gates
| Gate / Phase | Duration | Capital | Primary Scope of Work | Unlocked Milestone |
| Gate 1: Target Selection | 3 to 4 months | $1.5M |
Finalize desktop leads, rank prospective acreage, establish initial permitting frameworks.
|
Narrow asset portfolio to 3 to 4 Areas of Interest (AOIs).
|
| Gate 2: Field Validity | 6 months | $3.0M |
Mineral licensing across 2 AOIs; surface geochemical soil surveys to test gas migration pathways.
|
Prioritize 1 to 2 AOIs with confirmed surface anomaly signatures.
|
| Gate 3: Drill Readiness | 9 months | $9.0M |
2D/3D geophysics, structural model refinement, shallow strat-hole drilling, FEED/permitting readiness.
|
Deliver 1 to 2 drill-ready structures prepared for exploration drilling financing.
|
| Total Program | 18 to 19 months | $13.5M |
Full pre-drill program prior to development-stage underwriting.
|
Drill-ready status achieved.
|
Project Financial Model (Per Single Commercial Structure)
1. Baseline Assumptions & Technical Specifications
| Parameter | Texas Execution Case | California Benchmark Case | Basis / Source |
| Pre-Drill Equity Investment | $13.5M | $13.5M |
Program de-risking raise
|
| Commercial Facility CAPEX | $150.0M | $150.0M |
Extraction, purification, separation plant
|
| Construction Timeline | 4.0 Years | 4.0 Years |
Engineering, procurement, construction
|
| Annual Hydrogen Nameplate Output | 25.0 ktpa (25.0M kg) | 25.0 ktpa (25.0M kg) |
High purity grade (99.999%)
|
| Annual Helium Nameplate Output | 1.0 ktpa (1.0M kg) | 1.0 ktpa (1.0M kg) |
Ultra-high purity (up to 7N grade)
|
| Delivered Hydrogen Contract Price | $3.00 per kg | $5.00 per kg |
Pipeline / regional delivery within ~20 km
|
| Realized Helium Gate Price (EXW) | $90.00 per kg | $90.00 per kg |
Significant discount vs. ~$150 per kg market spot
|
| Direct Operating Cost (Hydrogen) | $1.00 per kg | $1.00 per kg |
Subsurface natural lift + processing
|
| Direct Operating Cost (Helium) | $8.00 per kg | $8.00 per kg |
Separation & liquefaction/storage
|
| Facility Operating Uptime | 97.0% | 97.0% |
Base industrial plant availability factor
|
| Discount Rate (Real) | 10.5% | 10.5% |
Project weighted average cost of capital
|
2. Steady-State Annual Operating Performance (Year 5+)
| Line Item | Texas Execution Case | California Benchmark Case | Notes |
| Gross Hydrogen Revenue | $72.75M | $121.25M |
Based on 24.25M kg sold
|
| Gross Helium Revenue | $87.30M | $87.30M |
Based on 0.97M kg sold
|
| Total Net Revenue | $160.05M | $208.55M |
Combined multi-gas stream
|
| Direct Hydrogen Operating Costs | ($24.25M) | ($24.25M) |
$1.00 per kg produced
|
| Direct Helium Operating Costs | ($7.76M) | ($7.76M) |
$8.00 per kg produced
|
| Total Direct Operating Costs | ($32.01M) | ($32.01M) |
Field extraction and processing opex
|
| Steady-State EBITDA | $128.04M | $176.54M |
Annual cash operating profit
|
| EBITDA Operating Margin | 80.0% | 84.7% |
High margin driven by helium co-production
|
3. Indicative Multi-Year Project Cash Flow Model (10-Year Snapshot in $M)
| Line Item ($M) | Year 1 | Year 2 | Year 3 | Year 4 | Year 5 (COD) | Year 6 | Year 7 | Year 8 | Year 9 | Year 10 |
| Pre-Drill Equity Tranche | ($4.50) | ($9.00) | — | — | — | — | — | — | — | — |
| Facility Construction CAPEX | — | — | ($75.00) | ($75.00) | — | — | — | — | — | — |
| Commercial Revenue (TX Base) | — | — | — | — | $160.05 | $160.05 | $160.05 | $160.05 | $160.05 | $160.05 |
| Operating Costs (TX Base) | — | — | — | — | ($32.01) | ($32.01) | ($32.01) | ($32.01) | ($32.01) | ($32.01) |
| Net Operating Cash Flow | ($4.50) | ($9.00) | ($75.00) | ($75.00) | $128.04 | $128.04 | $128.04 | $128.04 | $128.04 | $128.04 |
| Cumulative Net Cash Flow | ($4.50) | ($13.50) | ($88.50) | ($163.50) | ($35.46) | $92.58 | $220.62 | $348.66 | $476.70 | $604.74 |
4. Return Metrics & Sensitivity Summary
| Valuation Metric | Texas Execution Base Case | California Upside Case | Sensitivity Notes |
| Net Present Value (NPV at 10.5%) | ~$300M | ~$500M |
Driven by a +$2.00 per kg premium on hydrogen
|
| Internal Rate of Return (IRR) | ~38% | ~52% |
Robust downside buffer provided by helium sales
|
| Discounted Payback Period (DPP) | ~6.7 Years | ~5.7 Years |
Incorporates the 4-year development phase
|
| Helium Revenue Contribution | 54.5% | 41.9% |
Represents ~3.8% of product volume but over half of base revenue
|
Transaction Structuring & Partnership Terms
-
Financing Target: $13.5M technical exploration financing.
-
Entity Structure: Project-level special purpose vehicle (SPV) / asset-level partnership covering the Texas perimeter.
-
Cap Table Split:
-
80% Project Equity: Allocated to the incoming investor syndicate against $13.5M cash commitments.
-
20% Sponsor Equity: Held by the management founding entity in consideration of in-kind technical IP, proprietary geological algorithms, and desktop studies.
-
-
Syndicate Target: Seeking a lead investor commitment of $3.5M+ to set board governance, pacing, and tranche clearance criteria, supported by participating co-investors and corporate strategics from $1.0M+.







Description
Core Investment Thesis & Strategic Moat
Capital Tranches & Milestone De-Risking Gates
Project Financial Model (Per Single Commercial Structure)
1. Baseline Assumptions & Technical Specifications
2. Steady-State Annual Operating Performance (Year 5+)
3. Indicative Multi-Year Project Cash Flow Model (10-Year Snapshot in $M)
4. Return Metrics & Sensitivity Summary
Transaction Structuring & Partnership Terms
Basic Details
Target Price:
$ 0
Gross Revenue
$160,050,000
EBITDA
$128,040,000
Business ID:
L#20261218
Country
United States
State:
United States
Detail
Published on November 3, 2026 at 12:13 pm. Updated on November 3, 2026 at 1:05 pm